Phase to Phase logo 261px

Innovative ICT solutions for power systems
 

Detailed distribution grid insight with Vision Cloud Solution

In the coming years, analyses in low-voltage grids will play an increasingly important role due to the decentralisation of generation and changing user profiles. At the same time, the Consumer & Market Authority is making new, higher demands on grid safety. Distribution system operators can't possibly analyze and assess all MV and LV grids manually (and in conjunction).

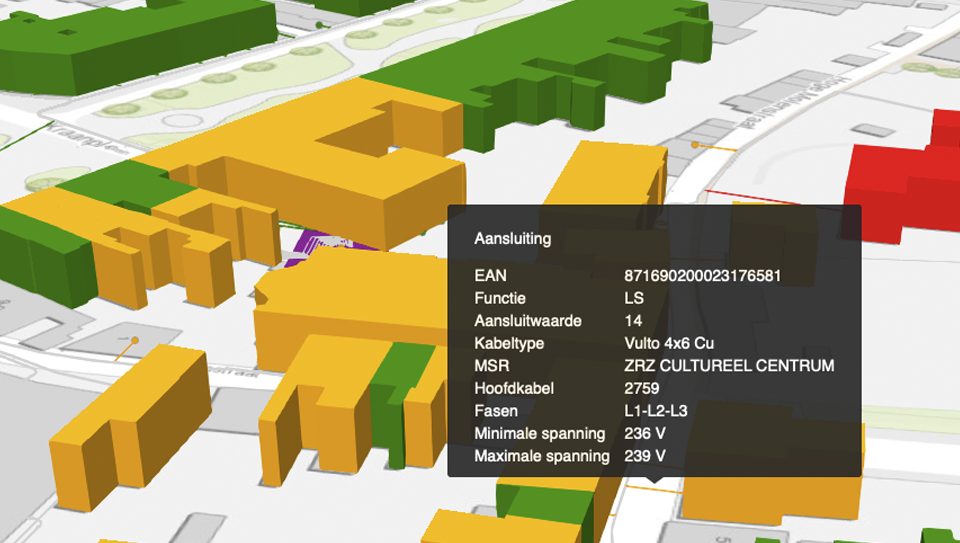
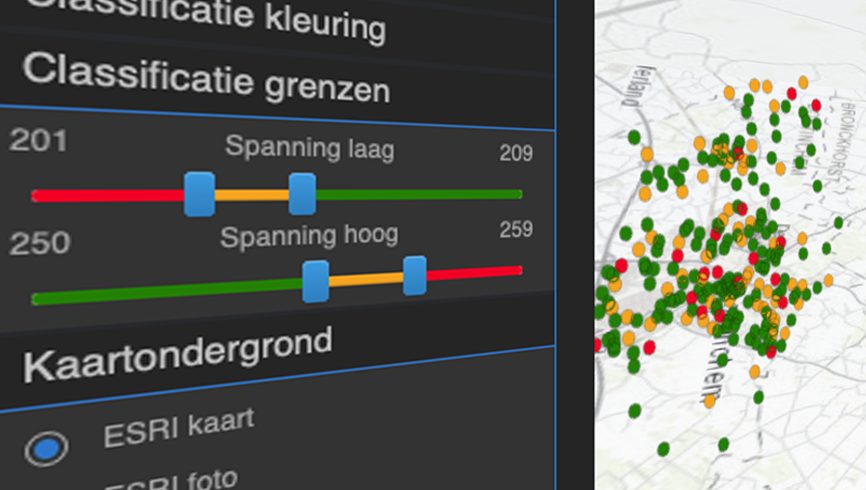
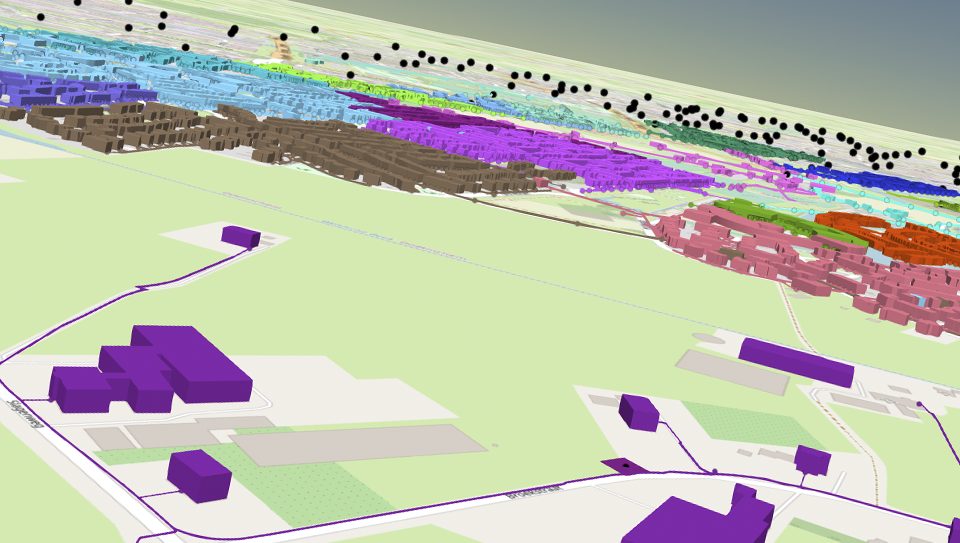
For this purpose Phase to Phase has developed the web application Vision Cloud Solution. Vision Cloud Solution automatically calculates, analyzes and assesses MV and LV grids. Asset managers, network designers, relationship managers and fault mechanics, but also other professionals gain insight on a large and small scale into the present and future behaviour of their grids.

Vision Cloud Solution can be used for grid planning, grid design and sustainable area development. Thanks to its clear, unambiguous presentation, Vision Cloud Solution also promotes communication and thus collaboration between authorities and the public.

 
Placeholder image
Placeholder image

As-is situations

Easy insight into current grid structure, grid capacity and grid and contact safety per component and aggregated per LV grid.

Self-adjustable colour classification.

Always up-to-date grid models available.

Placeholder image

What-if analyses

Rapid calculation of scenarios for increase of the number of solar panels (PV), heat pumps (HP) and charging stations (EV) in the grids.

At building, district, city or provincial level.

Click on components and view results.

Placeholder image

3D-geographical presentation

Actual net files (gnf, vnf) combined with up-to-date BAG (Land Registry and Mapping Agency) and CBS (Statistics Netherlands) data.

View power supply areas, with colours indicating which house connections are connected to which main cable or medium-voltage substation.

Suitable for standard maps and photo backgrounds. Link to Cyclomedia panorama photos possible.

Concept

Traditionally MV and LV grids are individually designed and analyzed with our desktop applications Vision Network Analysis and Gaia LV Network Design.

Now, Vision Cloud Solution offers the ability to automatically calculate, analyze and assess actual MV and LV grids in bulk. This applies to both 'As-is' situations and 'What-if' analyses. Vision Cloud Solution can be used by:

  • Asset managers
  • Grid designers
  • Relationship managers
  • Fault mechanics
  • Operators

Vision Cloud Solution consists of Vision Web, a web application with 3D geographical presentation via WebGL, and Vision Engine, a universally applicable calculation core accessible via an API.

Vision Web uses standard Vision and Gaia network files for presentation, calculations and analyses.


Placeholder image

Technical

Database with up-to-date data from network models, BAG (Land Registry and Mapping Agency) and CBS (Statistics Netherlands) data, calculation results and user generated scenarios

Vision Web links grid connections to buildings from the Land Registry and Mapping Agency and uses Dutch Statistics data such as contours of neighbourhoods and districts

Interface with the calculation core to perform calculations and analyses. The calculation core has an extensive set of calculation functions for network analyses and uses parallel processing over multiple cores. In addition, it is possible to have multiple instances of the core work together for bulk calculation tasks.

With dedicated plug-ins, company-specific interfaces are possible

‘As-is’ situation

Placeholder image

Insight in basic information

  • Location of medium-voltage substations (MSR), cables, cabinets, connections
  • Location of public lighting (OV): connections, cables, cabinets
  • Cable types, trafotypes
  • Where and how much: PV, HP and EV in LV grid
  • Connection data (such as EAN code, connection value, main cable, medium-voltage station)
  • Insight which connection is made to which phase
  • Filtering on phase (L2,L2,L3 or L1-L2-L3)
  • Filtering on public lighting (OV)
  • Colouring of standard annual consumption for extremes
  • Colors per outgoing field (main cable), colors per medium-voltage station
  • LV-connection linked to premises, showing which premises are connected to which main cable.
  • CBS neighbourhood and neighbourhood data in picture
  • Download vnf, gnf files for analysis in the Vision and Gaia desktop version.
  • Selectable possibilities for map and photo background
  • Linking with 360 degree panoramic pictures of Cyclomedia

Results of basic calculation

  • Load level of cables and transformers
  • Voltage at connections and LV rack in cabinets and medium-voltage station
  • Net safety (short-circuit time of connections and cables and short-circuit resistance of cables)
  • Contact safety (switch-off time and fault voltage at connections)
  • Impedance (phase impedance on connections)
  • Classification in 3 class/colours (adjustable)
  • Export results to Excel

What-if analyses

Placeholder image

Input scenarios

  • Rough scenarios, using sliders with penetration rates PV, HP, EV
  • Specific scenarios via selection of home connections
  • Multiple possibilities for selection of home connections: property, frame, district/neighbourhood, etc.
  • Input of specific amount of PV, HP and EV per connection, or overall by using sliders penetration rate
  • Input name and description of scenario
  • Scenarios are stored with the user

Results of scenarios

  • Load rating of cables and transformers
  • Voltage at connections and LV rack in cabinets and medium-voltage station
  • Classification in 3 classes (colours adjustable)
  • Comparison with basic calculation (as-is) situation
  • Comparison between different scenarios
  • Export results to Excel
Placeholder image

Administrator

  • Uploading vnf, and gnf network files
  • Upload/update BAG (Land Registry and Mapping Agency) and CBS (Statistics Netherlands) data
  • Add/delete user accounts and set permissions/roles

System characteristics

  • Flexible: The calculation core (Vision API) is completely separate from the web application (Vision Web) and can be used separately
  • Open data: uses open data (BAG (Land Registry and Mapping Agency) and CBS (Statistics Netherlands))
  • Map backgrounds via TMS/WMS (OSM, ESRI, Cyclomedia)
  • Open standards: no data lock-in. Uses Vision and Gaia network files, CSV, JSON files
  • Future-proof: uses modern techniques and open sources
  • Vision API can be extended with custom interfaces for your own applications
  • Easy linking of GIS, CMS and AD (including data quality monitoring)
  • Version control - central catalogue of scenarios, networks and areas with multiple versions (concept, approved, calculated, etc.)

Vision Web

Vision Web is the web application of the Vision Cloud Solution, accessible via browser on PC, laptop, tablet and phone.

  • Administrator interface for uploading network files and BAG (Land Registry and Mapping Agency) and CBS (Statistics Netherlands) data.
  • Standardized interfaces for online ESRI and OSM card backgrounds and Cyclomedia photo backgrounds via WMS/TMS.
  • User interface for interacting with database data and entering scenarios.
  • 3D WebGL for fast 3D visualization in the browser.
  • MySQL database with actual network data, BAG (Land Registry and Mapping Agency) and CBS (Statistics Netherlands) data, calculation results and scenarios.
  • Plug-in for reading Vision and Gaia network files.
  • Plug-in for reading of BAG (Land Registry and Mapping Agency) and CBS (Statistics Netherlands) data.
  • Interface with the Vision Engine for performing calculations and analyses


Placeholder image

Vision Engine

Vision Engine is the calculation core of the Vision Cloud Solution. It enables Vision Web to provide a large number of computational functions for network analysis.

With the API, the calculation core is accessible to external applications. The API is a REST service and is accessed via http post requests in JSON.

Company-specific interfaces are possible with dedicated plug-ins.

  • Calculation functions in DLL format including: load flow, short-circuit calculation, mains load, contact safety, etc. These functions are similar to those of the Phase to Phase desktop applications Vision Network Analysis and Gaia LV Network Design.
  • Very fast algorithms to perform extensive analyses and scenarios in bulk.
  • Thread pool task management for parallel processing local (multiple computer scores) and global (multiple servers) application.
  • All calculations and analyses for Vision Web.
  • API for separate use of the calculation core.

Vision and Gaia Network Files

Vision Cloud Solution uses Vision and Gaia network files (*.vnf and *.gnf) for calculation, analysis and location .

These files are generated separately from various sources such as GIS and SCADA. A Network Builder generates a Vision of Gaia network file that is checked by a Checking Engine.

A faulty network file is an indication of data errors and is presented with extensive log information to the Data service desk. These data errors are then resolved in the source systems.


Placeholder image

The network files successfully reviewed by the Checking Engine are stored in a Content Management System and are available for Vision Cloud Solution and the desktop applications Vision Network analysis and Gaia LV-Network Design.


Since source files and systems vary greatly from company to company, the development of the Network Builder and Checking Engine is customization.

For smaller DSOs Network Builder and Checking Engine can be desktop applications, for larger DSOs these are available in an API that runs on a server. Generating network files can then be executed fully automatically.